
Table of Contents
- What Corneal Mapping Measures and Why Your Doctor Orders It
- How to Read a Corneal Topography Map Step by Step
- Corneal Topography Colors Meaning: What the Map Scale Tells You
- Pentacam Results Explained: Reading the Numbers Behind the Colors
- Corneal Mapping for Keratoconus and Ectasia Screening
- Normal vs. Abnormal Patterns and What Affects Reliability
- What Your Results Mean for You and What to Ask Next
- Frequently Asked Questions
Last Updated: October 18, 2026
What Corneal Mapping Measures and Why Your Doctor Orders It
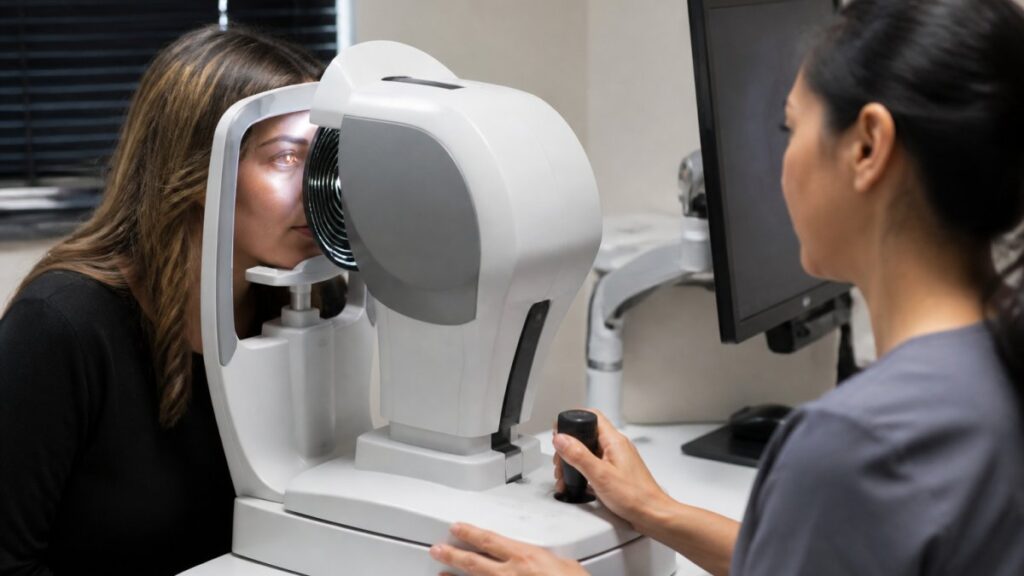
Corneal mapping is a scan that measures the shape, curve, and thickness of your cornea, the clear front window of your eye.
Your cornea does most of the focusing, so even a small shape change can blur vision or signal a condition that needs watching.
Doctors order a map for several reasons:
- Before LASIK or other refractive surgery, to confirm your cornea is strong enough
- To check for keratoconus, a condition where the cornea slowly bulges
- To fit contact lenses, especially for irregular corneas
One scan produces thousands of data points. You don’t need to memorize them, just understand what the main maps and numbers tell you.
How to Read a Corneal Topography Map Step by Step
Reading a corneal topography map means looking at three things in order: curvature first, then elevation, then thickness. Most reports print all three side by side, which feels overwhelming at first, but a fixed reading order makes the layout familiar.
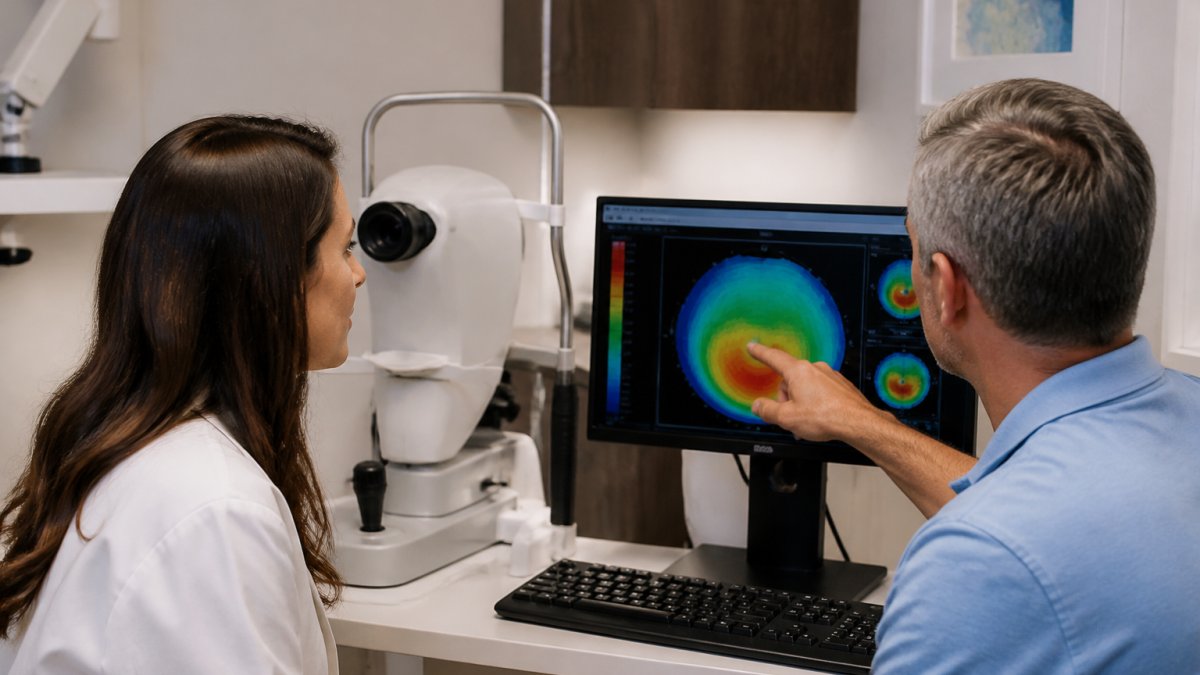
Here is the reading order we walk patients through, using a typical four-map report as the example.
Step 1: Find the Patient and Eye Labels First
Before you look at a single color, confirm the report belongs to the right person and eye. Reports label the eye as OD (right) or OS (left), and a scan of the wrong eye is the most common reason a comparison looks alarming. Check the date and device name too: when comparing to last year’s scan, the device and software version should match, because different instruments build maps from different reference surfaces.
Step 2: Read the Curvature Map
The curvature map shows how steep or flat your cornea is across its surface. Warm colors like red and orange mark steeper areas. Cool colors like blue mark flatter ones. Green usually sits in the middle range.
A normal cornea is slightly steeper in the center and flattens toward the edges. A tidy, centered warm pattern is a good sign; warm colors off to one side or in an odd shape prompt a closer look.
Step 3: Check the Elevation Map
The elevation map compares your cornea to a perfect reference surface: does it rise above or dip below where it should be? Small differences are common; larger ones can point to a weak spot.
Elevation maps usually come in pairs: one for the front (anterior) surface and one for the back (posterior) surface. The posterior map matters more than many patients realize, because a back surface that rises higher than expected can be an early signal of a weakening cornea even when the front looks normal.
Step 4: Read the Thickness (Pachymetry) Map
The thickness map, called a pachymetry map, shows how thick your cornea is point to point. The thinnest point gets flagged because thin spots are more fragile. Typical central corneal thickness in a healthy adult falls in the 500 to 600 micrometer range, but normal varies with age and device, so treat any single number as a starting point rather than a verdict.
Step 5: Look at the Numbers Panel Last
Most reports print a column of summary numbers beside the maps. Read these last, after the shapes, because the numbers confirm what the maps show. The panel usually includes the flat and steep keratometry readings, the steepest point (Kmax), the thinnest pachymetry value, and screening indices.
A simple habit that helps: cover the numbers panel with your hand, look at the four maps in order, and say out loud what shape you see. Then uncover the numbers and see whether they agree. Patients who practice this once or twice stop feeling lost in the layout.
A Worked Example of the Reading Order
Imagine a report where the curvature map shows a warm patch sitting low and slightly to one side, the front elevation map shows a small raised area in the same location, the back elevation map shows a more pronounced rise, and the thickness map shows the thinnest point directly under that patch. Read in order, the four maps tell one consistent story: a localized area that is steeper, higher, and thinner than the rest of the cornea, the pattern a doctor would want to monitor.
What to Do If the Layout Looks Different From This Example
Not every report uses four maps. Some print two, some print eight, and some put the numbers in a different corner. The reading order still works: confirm the labels, read curvature, read front and back elevation, read thickness, then read the numbers. If a report includes maps you do not recognize, ask the technician which is which before your appointment ends.
Corneal Topography Colors Meaning: What the Map Scale Tells You
The colors on a corneal topography map are a scale, not a diagnosis. Each color stands for a range of values, and the range depends on the scale your doctor selected.
A simple way to think about it:
- Blues and greens usually mean flatter or lower areas
- Yellows and oranges mean steeper or higher areas
- Reds mark the steepest spots
What matters most is the pattern, not a single color. A small red patch in the center of a normal-shaped map often means little; a red patch low and off-center with a thin spot underneath tells a different story.
Never diagnose yourself from a color map. The same shade of red can be normal on one eye and a warning sign on another, depending on age, contact lens use, and the device used. Only your eye doctor can put the colors in context.
Pentacam Results Explained: Reading the Numbers Behind the Colors
Pentacam results explained in plain terms come down to a handful of numbers your doctor actually uses. The Pentacam is a rotating camera that builds a 3D model of the front of your eye; that model produces the maps, and the maps produce the numbers. You do not need to memorize all of them. Focus on these, and remember that every threshold below is a general guide, not a cutoff, normal ranges vary by device, reference population, age, and history.
K Readings, Kmax, and the Steep Meridian
K readings are keratometry values, which measure the curve of your cornea in diopters. A typical cornea sits around 42 to 44 diopters, though normal varies by person.
Kmax is the steepest point on the cornea, measured in diopters. A rising Kmax over time is one signal doctors watch for keratoconus.
The steep meridian is the direction where the cornea curves most. The flat meridian is 90 degrees away.
Pachymetry: The Thinnest Point and Where It Sits
Pachymetry gives the thinnest point of your cornea in micrometers. Typical central thickness in a healthy adult is roughly 500 to 600 micrometers, but the number drifts with age and varies by device. Your doctor compares it to a normal range for your age and looks at where the thin spot sits. A thinnest point in the center is common; one low and off-center, under a steep area, prompts closer follow-up.
Elevation Values: Anterior and Posterior
Elevation maps also produce numbers, usually in micrometers above or below the reference surface. Small elevation values, a few micrometers, are normal on both surfaces. What doctors watch is the posterior (back) surface, because a back surface that rises more than expected can be an early sign of a weakening cornea even when the front looks unremarkable.
Screening Indices and What They Are For
Most reports include one or more composite indices, numbers that combine several measurements into a single score to flag eyes that deserve a closer look. These are screening tools, not diagnoses: a value outside the typical range means “look closer,” not “you have a disease.” Different devices use different indices with different scales, so an index from one brand cannot be compared to another.
Why the Same Eye Can Produce Different Numbers on Different Devices
This is the part most patients are never told. Two instruments can measure the same eye and report Kmax values that differ by a fraction of a diopter, or pachymetry values that differ by several micrometers, because they use different reference surfaces, detection methods, and software versions. That does not mean one is wrong, it means the numbers are only comparable within the same device and software.
Do not compare a Kmax or pachymetry value from one practice’s device to a value from a different device and conclude that your cornea has changed. Ask which device produced each report before you draw any conclusion.
A Quick Reference for the Numbers You Will See Most
- K1 and K2, flat and steep keratometry in diopters; the gap is your astigmatism
- Kmax, steepest point in diopters; watch the trend, not just the value
- Axis, the direction of the steep meridian in degrees; the basis of your prescription
When you get a copy of your report, ask which numbers your doctor is tracking and write them down, along with the device name and the date. Comparing this year’s Kmax and thinnest-point readings to last year’s on the same device is far more useful than staring at a single scan in isolation.
Corneal Mapping for Keratoconus and Ectasia Screening
Corneal mapping for keratoconus is the main reason doctors order this test in younger patients.
Catching it early changes the outcome. When keratoconus is found before vision drops sharply, doctors have more options to stabilize the cornea.
Ectasia is a similar weakening that can develop after refractive surgery.
According to the American Academy of Ophthalmology’s guidance on keratoconus, early detection and monitoring are central to managing the condition.
Normal vs. Abnormal Patterns and What Affects Reliability
A normal map shows a smooth, centered curve with symmetric colors and no thin spots off to one side.
Two machines may use different reference surfaces and color scales, so comparing scans from different devices is risky.
We tell patients to skip contact lenses for the period their doctor advises before a scan. It is a small hassle that protects the accuracy of the result.
What Your Results Mean for You and What to Ask Next
Your map is a tool, not a verdict. A single scan rarely decides anything on its own. Your doctor pairs it with your vision, your history, and past scans to reach a conclusion.
Here is what we suggest you ask at your next visit:
- Which numbers are you tracking, and how did they change since last time?
- Is my pattern stable, or is it progressing?
- Does this affect my options for LASIK, contacts, or cataract surgery?
Write the answers down. Bring them back next year.
At Clear Vision San Antonio, our eye doctors use advanced imaging to map your cornea and explain what the results mean in plain language.
Frequently Asked Questions
What do the colors on a corneal map actually mean?
The colors show curvature, not health directly. Warmer colors like red and orange mark steeper areas where the cornea bends light more strongly, while cooler colors like blue and green mark flatter areas. A normal cornea usually shows a fairly even green-to-yellow pattern. Patches of red in one spot, or a color pattern that looks lopsided, is what prompts a closer look. Your doctor compares the color pattern against the numbers on the same report before drawing any conclusion.
Can corneal mapping detect keratoconus?
Corneal mapping is one of the main tools used to detect keratoconus and ectasia. It shows steepening, thinning, and elevation changes on the posterior surface that a standard eye exam can miss in the early stages. No single map proves a diagnosis on its own. Doctors combine the map with thickness readings, a slit-lamp exam, and a history of changing prescriptions. If you have steadily worsening astigmatism, ask whether corneal mapping is part of your evaluation.
Does an abnormal corneal map mean I have an eye disease?
Not necessarily. An abnormal pattern can come from a poorly captured scan, dry eye, contact lens wear, or normal variation in corneal shape. That is why repeat scans and a full exam matter. A single red patch on one map is a reason to look further, not a diagnosis. Ask your doctor whether the finding was confirmed on a second measurement and how it compares with your earlier scans.
What should I ask my eye doctor about my corneal mapping results?
Ask four things: which values are outside the normal range, whether the finding appeared on repeat scans, how the numbers compare with your last report, and what the result means for contact lenses, LASIK, or cataract surgery planning. Bring your previous reports if you have them. A single report is a snapshot; a series of reports over time shows whether anything is actually changing.